Monday, December 5, 2011

MySQL command Using MAMP PRO

I am writing this to just remind myself and share how to access MySQL with MAMP.  To access MySQL with MAMP PRO or MAMP on a terminal window for MacOS X,
First off, you want to install MAMP or MAM Pro on your computer. Go to download it at http://www.mamp.info/en/index.html
Second, open a terminal window

Third, type in   /Applications/MAMP/Library/bin/mysql --host=localhost -uroot -proot;
(Don't forget to type ";" to end a commend.)


And now you can start using MySQL commands.  Good Luck! 

Wednesday, November 23, 2011

Statistics of Turkeys - Production, Measured in Dollars in 2010


Happy Thanksgiving, everyone!
Tomorrow is Thanksgiving, Thursday, November 24, 2011.   I am having Thanksgiving with my friends in San Francisco. What about you guys?
I would like to relate Thanksgiving to Statistics.  So I came up an idea, looking at statistics of Turkeys- Production that measured in dollars.  I got the data set from http://quickstats.nass.usda.gov/#202F2C40-1ADA-33FE-ADA4-689C43CEFEA4, and made a bar chart and did the calculation from MS Excel.  According to the record, the highest value is $736,819,000 from the State of Minnesota, and the lowest value is $53,940,000 from the State of West Virginia.


Feel free to leave me a comment down below. Thank you!

Monday, November 21, 2011

Print and Cat in R


Print : we use print when we want R to print something.
Cat:  we can use the cat function as an alternative way to ask R to print something.

> pi
[1] 3.141593

> sqrt(2)
[1] 1.414214

> print(pi)
[1] 3.141593

> print(sqrt(2))
[1] 1.414214

> print(matrix(c(1,2,3,4,5,6,7,8),4,4))
     [,1] [,2] [,3] [,4]
[1,]    1    5    1    5
[2,]    2    6    2    6
[3,]    3    7    3    7
[4,]    4    8    4    8

> print(list("a","b","c"))
[[1]]
[1] "a"

[[2]]
[1] "b"

[[3]]
[1] "c"


> print("The zero occurs at"); print(2*pi); print("radians")
[1] "The zero occurs at"
[1] 6.283185
[1] "radians"

> cat("the zero occurs at", 2*pi, "radians.", "\n")   # using (\n) to terminate the line
the zero occurs at 6.283185 radians.

> x<-c(2, 3, 5, 7, 11, 13, 17, 19)
> cat("The prime numbers under 30 are:",x,"...\n")
The prime numbers under 30 are: 2 3 5 7 11 13 17 19 ...


Statistics VS Probability

Statistics is the study of the collection, calculation, description, organization, analysis, classification and interpretation of numerical facts or data.
Probability is the branch of mathematics that studies the possible outcomes of given events together with the outcomes' relative likelihoods and distributions.
Let's say that statistics is dealing with data, but probability is all about chance.

Thursday, June 23, 2011

PROC CONTENTS and Set Options for Outputs

libname mozart 'C:\books\learning';
data mozart.test_scores;
    length ID $ 3 ;
    input ID $ Score1-Score3 ;
    datalines;
    1 90 95 98
    2 78 77 75
    3 88 91 92

    run;
title "The Descriptor Portion of Data Set TEST_SCORES";
proc contents data = Mozart.test_scores;
run;

proc datasets;      
contents data=Mozart.test_scores;
run;
/*variable in creation order*/
title "The Descriptor Portion of Data Set TEST_scores";
proc contents data = Mozart.test_scores varnum;
run;

title "Listing All the SAS Data Sets in a Library";
proc contents data = Mozart._all_ nods;
run;

proc contents data=Mozart.Sales;
run;

/* Using a SAS data set as in put to a DATA step*/
data new;
    set mozart.test_scores;
    AveScore = mean(of score1-score3);
    run;
title "Listing of Data Set NEW";
proc print data = new;
    var ID Score1-Score3 AveScore;
    run;

options nonumber nodate;
proc print data = new;
    var ID Score1-Score3 AveScore;
    run;
/*options nodate pageno=3;*/

/* The PAGESIZE= option specifies how many lines each page of output contains. In the following
example, each page of the output that the PRINT procedure produces contains 15 lines (including
those used by the title, date, and so on).
    options pageno=1 pagesize=15;*/

/*  The LINESIZE= option specifies the width of the print line for your procedure output and log.
Observations that do not fit within the line size continue on a different line.

    options pageno=1 linesize=64;*/

/*using FIRSTOBS= and OBS= for Specific Data Sets 
    OBS indicates row variables*/
options firstobs=1 obs=2;
proc print data=new;
run;
/*specifying FIRSTOBS =  and OBS= as data set options*/
options firstobs=1 obs=2;
proc print data=new(firstobs=1 obs=3);
run;

/*The OPTIONS Procedure displays the current setting of one or all SAS system options
The results are displayed in the log*/
proc options;
run;

Tuesday, May 17, 2011

Beta(b, b)


For beta <1 the density is bathtub shaped. For beta = 1 the density is uniform between 0 and 1. For beta >1 the density has a mode at 0.5 and as beta increased the density is more concentrated around 0.5.  x~Beta(b, b)

Saturday, April 30, 2011

OpenBUGS or WinBUGS for MAC OX users


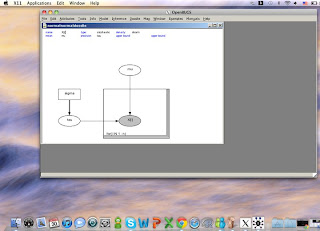
I was having a hard time to install OpenBUGS. At first I didn't know how to install it. I found out that It is not compatible for Macintosh. I found this helpful website.
So I followed it step by step. I installed completely it using Wine and WineBottler to call OpenBUGS. I am very excited about using it.
I would like to share it with everyone. I hope it's helpful.
Good luck
Serebii

Installing OpenBUGS or WinBUGS in Mac OS X using WineBottler
Instructions
  1. Download and install Wine and WineBottler.
  2. Download the OpenBUGS installer for Windows or the WinBUGS installer (direct link). I’ll refer to your download as xBUGS from here on in.
  3. Open WineBottler and select “Create Custom Prefixes”.
  4. Select the xBUGS installer you just downloaded as the Install File.
  5. Check off “dcom98” in the Winetricks menu (as per instructions here).
  6. Click “Install.” Call the file “xBUGS.app” or something similar. This is the Mac application that will be created.
  7. Go through the install process.
  8. At the end of it, WineBottler will ask for the executable to run on start-up. Select OpenBUGS.exe or WinBUGS14.exe.
  9. Navigate to the newly-created xBUGS.app file and double-click it. You should (eventually) see the expected xBUGS interface.
If you installed WinBUGS instead of OpenBUGS, you’ll have to go through the standard patching process described on the WinBUGS website.

You can also check the links below:
http://www.openbugs.info/w/
http://www.aidanfindlater.com/installing-openbugs-in-mac-os-x-using-winebottler


Tuesday, January 11, 2011

How to export R graph on OpenOffice.org


I was having a hard time to export R graphs to OpenOffice.org on MAC OS. I did research it. I finally figured it out.
1), you wanna download Oracle PDF Import Extension (http://extensions.services.openoffice.org/project/pdfimport?intcmp=1549). This import plugin is now. Yet, it seems to work well for importing R graphs saved in PDF 2). Here is how you use it.
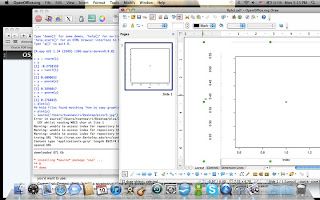
2) Import your PDF graph in OpenOffice once the PDF import plugin is installed. You graph is displayed in an OODraw window. You can easily post-process it there, if you like.
3) select all of your graph and copy it.
4) open or switch to a text document in OOWriter, or to a presentation in OOPresenter, and paste your graph there. This is a little long but has the advantage of allowing further edition of your graph in place, just by double-clicking in it!

Now I can easily use R to do project and OpenOffice.org on my MAC! hehe

Good Luck,
serebii